
Household Wealth in the US, 1998
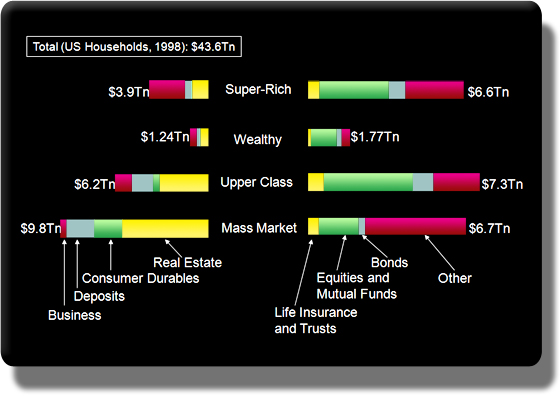
The data shown are based on a 1998 survey, combined with Flow of Funds data, but are the most recent available in this level of granularity. Although the absolute values of individual items will have changed since then, the overall dominance of investment-type assets among the wealthiest will be the same today.
One of the challenges facing banks seeking to gain “share of wallet” among the very wealthiest households is the need to offer products and services catering to this group. The chart indicates, for ownership of financial assets, the sharp contrast between the “super-rich” (i.e. the wealthiest ½ % of households) and the “mass market” (i.e. the least wealthy 90% of households). The “mass market” have their financial assets concentrated among assets that fall within the realm of traditional banking: real estate, deposits and small business. As shown in the chart, about 60% of the assets of the “mass market” ($9.8Tn) are held in such "banking type” assets. Whilst the ratio of “banking” to “investment” assets is about 60-40 for the “mass market”, the reverse is true for the wealthiest ½ % of households. Gaining “share of wallet” among the “super-rich” will require banks to offer compelling services related to their asset holdings.
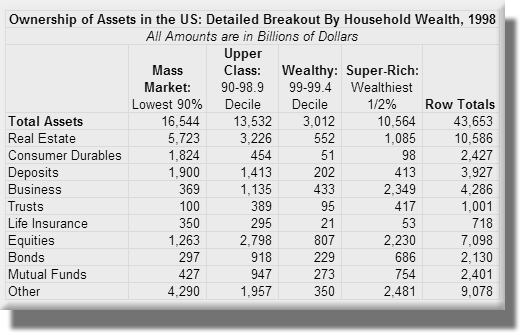
Data shown are for 1998, and are based on a US government survey of consumer finance.
Source: Federal Reserve, Bureau of the Census and Nechtain


